Description
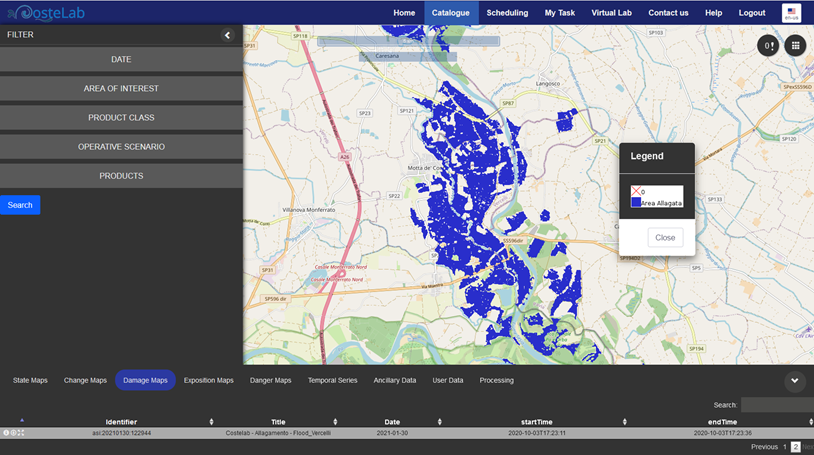
- Map of extension and location of flooded coastal areas, obtained through satellite SAR data, through fully automated processing
- The Flooding product provides the extent and location of flooding in coastal areas
- e-Geos has developed an automatic tool to extract the extent and location of flooded areas from SAR images, operationally used since 2011 in emergency services in the context of Copernicus services
- Algorithm
- The approach uses a Machine Learning algorithm trained on the permanent waters present in the acquired scene to identify waters due to flooding.
- The permanent waters in the analyzed scene are identified through the use of the global water layer ( Global Surface Water )
- Features on the image are calculated (RCS, RCS mean and standard deviation)
- Generation of the training data set by automatically associating the labels extracted from the permanent water layer to the pixels with features (RCS, mean , std )
- Training the One- Class Support Vector Machine (ML )
- Carrying out the prediction on the whole image in order to find the map of all the waters in the scene.
- Removal of permanent waters from the previous result, obtaining a vector map of the flooded areas.
Operating scenarios
- Post event
Technical specification
| Requirement | Description |
| Spatial resolution | 1 to 10 m (depending on the SAR data used for estimation) |
| Coverage area | From 100 to 60,000 Km ^ 2 (depending on the SAR data used for estimation) |
| Geographic accuracy | 5 m |
| Information Age | 1 month |
| Measurement uncertainty | 80% in coastal areas |
| Measurement / projection unit | Classes: flooded / non-flooded projection: geographic ( lat / lon ) |
| EO data in input | SAR data from COSMO- SkyMed , Sentinel-1 |
| Input data used | Coastline, DEM, ECMWF forecasting models |
| Given for validation | Coeval MS VHR optical data |
| Format | Shape file |
| Refresh rate | Given the availability of the SAR data on the area of interest: 12 h |
Example